Over the last few years, Private Equity (PE) firms have seen exceptional returns on their portfolios and, coupled with an influx of investor capital into these firms, we have seen mergers and acquisitions (M&A) transactions grow significantly. According to data gathered from S&P Capital IQ, the last three months (Jul’21 – Sep’21) aggregated deal amount for US private equity investments totaled $243B in 2,841 transactions for an average deal size of $85M. Compare this to the same period in 2019 where the aggregated deal amount was $78.5B with an average deal size $45M, this represents a ~3X growth in M&A transaction dollar volume and a 90% growth in the average deal size. There are undoubtedly several factors for this increase in transaction volume, but one major driving force of attraction to the PE space is the excess returns when compared to public equity indexes such as the S&P or DJIA.
As shown in the table below with data as of March 2018, Cambridge Associates conducted a study on 1,500 private equity funds including buyout, growth equity, and subordinated capital funds, and compared their returns to common indices.1
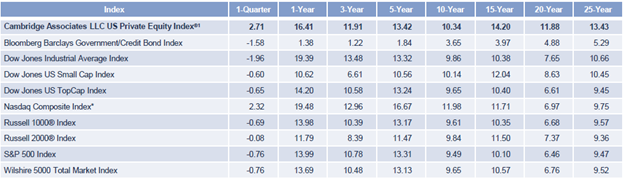
Generally speaking, the private equity index outperformed other common indices, but this becomes even more solidified as we look at longer time-horizons. So, how do private equity funds consistently deliver higher returns and assure that they are maximizing shareholder value? As a proven partner to numerous private equity companies, we believe measuring Economic Value Add (EVA) and focusing on improved performance of this metric delivers the best results.
Measuring Economic Value Add (EVA)
In a related article, my colleague Arun Shukla, describes an elegant approach to evaluating value creation using EVA. For more information on this approach please read Arun’s article in its entirety, but to summarize, EVA’s equation of NOPAT – (WACC * Capital Invested) helps measure how effective leadership is at driving value creation and deploying business capital.
Breaking down the components of EVA, net operating profit after tax equals EBIT * (1 – tax rate). The next part of the equation, capital invested, can be calculated as total assets minus current liabilities. Finally, weighted average cost of capital (WACC) is made up of two components which are the cost of debt and cost of equity to the firm. Once these components have been calculated, the economic profit of the business can be measured effectively, however, measuring EVA is only the tip of the iceberg. The leadership team must be able to unpack the results of the EVA calculation, adjust capital deployment to maximize returns, and devise strategic initiatives to improve operating profit.
Target Success – Not Financial Results – To Improve Profit
This time of year, in the late third quarter or early fourth quarter, companies are solidifying their budgets which often include aspirational profit growth and a long list of spending requests to achieve their growth targets. Instead of trying to predict next year’s results based on a bottom-up view and spending requests that are likely to be cut 10-30%, we find it’s more effective to focus on improving outcomes for customers and stakeholders of the business. A few questions which can help develop a strategy for delivering these outcomes are:
• What are the key challenges faced by the business and their customers, and what initiatives will drive the most growth in the coming years?
• Based on the above, how should resources (capital and human) be allocated? What is the optimal mix between maintaining existing products, innovating new products, expanding sales and marketing channels, or developing internal talent?
• Further, to which geomarkets should these resources be deployed and at what velocity?
The approach described herein is similar to an x-matrix, or a Hoshin planning matrix, which aligns long-term goals with specific targets to improve in order to execute on the strategy. Bridging the strategic initiatives with resources and targets in such a manner not only enables transparency in the process, but also creates accountability that transcends the entire organization.
At this point, it’s important to circle back to the budget and create a plan that is adaptable and easily refreshed. In recent years, we have seen a black swan event in COVID, market volatility, supply chain crises, and other factors that make budgets quickly irrelevant. No one can predict the future with complete accuracy and it’s therefore instrumental to refresh a budget on a routine cadence, performing a BVA with business leaders and functional budget owners monthly or quarterly. In these reviews, targets tied to your strategic initiatives should be evaluated and the necessary adjustments made to continually maximize EVA.
In a world of increasing complexity and information available at our fingertips, it can be difficult to know the right measures to evaluate a business and the associated levers to pull to effectuate change. We believe focusing on EVA will drive the best returns for shareholders, and following a decisive, strategic approach to capital investment will accelerate the value creation. This comes full circle as NOPAT will be improved through topline growth and an optimized cost structure. Unpacking all the components of EVA and establishing the stringent processes is not easily, but realizing the growth attained by using this approach makes it well worth the effort.