Background
Adapt and innovate are rules to live by – not only to survive but to thrive in today’s business environment. The hottest trend amongst these adaptive and innovative movements is the adoption of Key Performance Indicators, or KPIs. The rise of useful (and accessible) software programs, quality data, and pressure to adapt and innovate has nudged organizations towards hyper-focusing on the creation and utilization of KPIs at all levels. While this shift is directionally correct, becoming completely reliant on KPIs while ignoring other relevant factors can result in unintended consequences.
A KPI is measurable value that can help organizations track performance over time. They include leading, lagging, financial, non-financial, quantitative, and qualitative indicators.
• Leading indicators is data that corresponds with a future movement or change in some phenomenon of interest. These tend to be operational metrics used to predict other operational or financial outcomes. Examples include average cycle times, defect rate, or number of products a customer purchases.
• Lagging indicators are statistics that follow an event and are usually used to confirm what has recently happened and establish trends. These tend to be financial metrics that track how well the organization is doing. Examples include profits, revenue, expenses, renewal rate, or customer count.
• Financial KPIs indicate a company’s financial results and performance. Examples include accounts payable turnover, accounts receivable turnover, returns on assets, return on equity.
• Operational KPIs indicate an organization’s business performance in a shorter time-frame internal. They are not standard like financial KPIs and are usually associated with optimizing time, cost, quality, and customer metrics varying by function and type of business.
• Quantitative KPIs are measures that involves numbers in a variety of forms.
• Qualitative KPIs help classify variables for market, demographic, product, or geographical segmentation analysis.
When used correctly, KPIs clarify business operations, guide strategy, and drive activities for outsized impact and improved productivity. However, there are risks to poorly developed KPIs including incentivizing bad behavior and stifling creativity and growth. So, how does one survive in a world that is hyper-focused on KPIs?
Read on to learn why KPIs are important, what the risks are for poorly developed KPIs, and how to develop and leverage KPIs effectively.
Why are KPIs important?
KPIs help factualize intuition about your business. “What KPI will we use to track this?” is a common question we get from clients. The answer we generally provide is that it depends on what business activities or goals our clients are working to achieve.
Clarity of critical outcomes ensures we know what to focus on. Determining what KPI to use for tracking is a valuable process that requires investigation into all levels of a business to understand how activities add up to stated goals. Think about how a car mechanic takes apart an engine to reach a broken part. In the process, they naturally inspect each related, connected part, and thus diagnoses the pathways that support the fix. The same process can be applied to the development of KPIs. By researching the effects of an outcome, we can diagnose the causes and build a better understanding of a business supported by data. This process also ensures that KPIs drive the right activities and behavior to maximize impact.
Driving the right behavior of employees and managers is critical to any organization. Carefully crafted operational KPIs can flag deviation from process norms, and other process inefficiencies such as backlog, queues, or high cycle times before these issues negatively impact business. These leading indicators incite action and allow managers to hold their employees accountable. For example, a common warehouse KPI for service operations is order backlog. The problem it solves is ensuring technicians and field personnel get the right equipment on time to meet customer SLAs. From anywhere in the world, the warehouse manager can check in to ensure all orders will get out that day. KPIs provide guardrails to drive effective behaviors by aligning all stakeholders to a common goal improving operational efficiency and effectiveness as well as productivity.
KPIs also help guide strategy. Long-term strategic initiatives include qualitative and quantitative metrics. These KPIs are big picture-focused and include a mix of operational and financial metrics. They provide the means for tracking progress every month, quarter, and year to ensure an organization is meeting its intended targets or can pivot accordingly. This data-driven approach creates proof to support strategic vision.
How do you develop KPIs?
The art of developing effective KPIs starts with clear strategic objectives and supporting activities. Additionally, it assumes an organization’s systems support the activities that enable key outcomes. You cannot develop KPIs if you cannot measure operational data within a system (CRM, ERP, SCM, etc.).
Steps for effective KPI development:
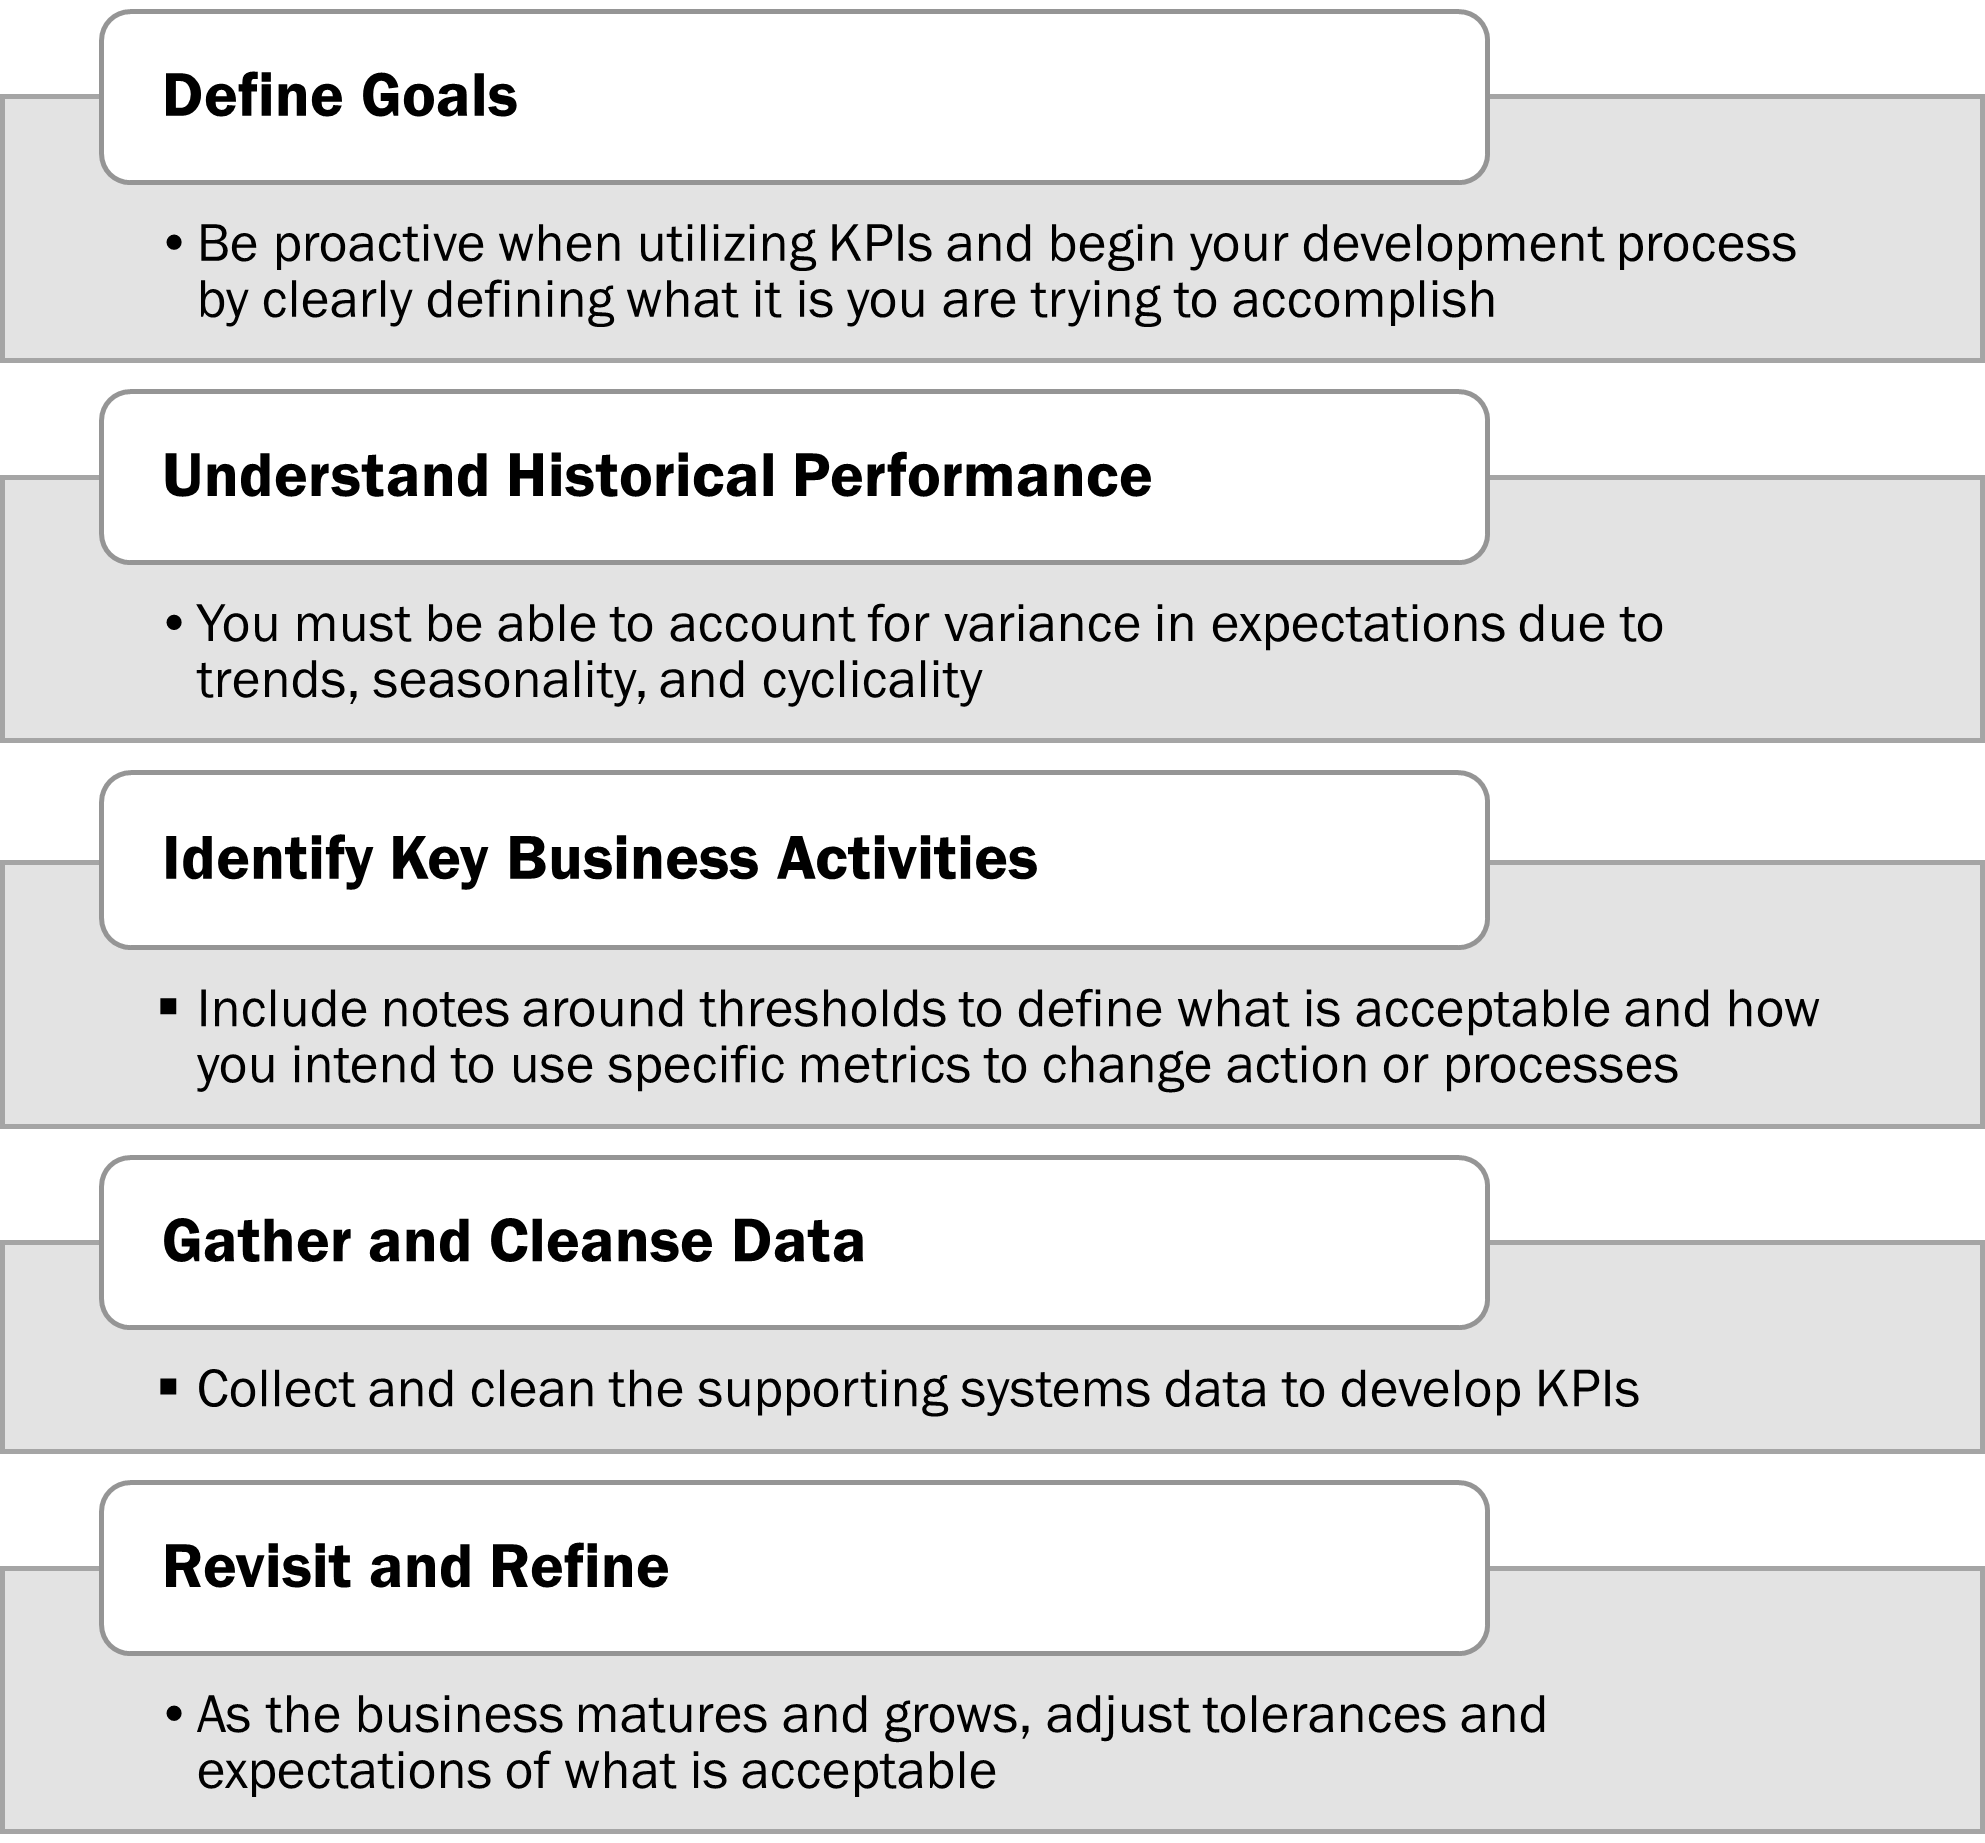
Additional consideration in creating, implementing, and monitoring KPIs should be given to linked roles and responsibilities. There may be instances when a KPI supports a different functional area. Clear responsibilities should be determined on who owns, maintains, and monitors KPIs. This too may come from a separate functional area and should have linkage to the groups who are key to the KPI itself.
The delivery method for KPIs is commonly in the form of a dashboard or visualization. That includes enterprise level technologies likes Salesforce, SAP, Oracle as well as visualization software like PowerBI, Tableau, or even Excel. Dashboard visualizations can be operational, financial, or strategic. As maturity in KPI adoption has increased, organizations are deviating from data tables, pivot tables, heat maps, etc. to interactive software dashboards within cloud-based software applications. Nevertheless, personnel should be able to extract data for root causes analysis and presentation features when issues arise.
Dashboards should include between five and seven metrics to avoid overwhelming the consumer or leading to analysis paralysis. Operational dashboards help employees and managers to oversee day-to-day operations. Each functional unit should be measured along their own unique activities and one or two common organizational level KPIs. For example, on-time delivery date should be a metric every e-commerce platform company cares about. However, different team members will have different roles in accomplishing the goal of the KPI and subsequently, each function will have unique, tactical KPIs. Financial dashboards help P&L owners and leadership trend key financial metrics to assess the financial health of the business weekly, monthly, and quarterly. Strategic dashboards help measure the operational and financial impact of key initiatives across months, quarters, and years. These dashboard subsets should roll into one centralized dashboard that combines the most important metrics for senior leadership.
Many organizations innately understand the broad leading indicators to increase revenue or gross margin. However, more sophisticated KPIs are difficult to identify because they happen across complex systems and multiple functions, geographical regions, and product lines. This is where advanced analytics comes to play. For example, let us look at the manufacturing industry. Some leading indicators that leverage advanced analytics could look like:
• Product Line A’s Inventory Turnover rate is X and First-Pass Yield is Y, we can reasonably expect Z% in terms of On-Time-In-Full (OTIF)
• If Expedited Shipments are less than X% and OTIF is at Y, then we can expect that we are delivering on a cost-efficient basis (and can calculate our savings!)
• If X% of products received from suppliers are Defect-Free, we can expect our Escape Rate to be below Y%
These KPIs are extremely powerful because they intuitively transition from predictive to prescriptive in the minds of personnel. As team members become more comfortable with the meaning behind the numbers, they internalize the relationships and know what levers to pull to correct for issues as they arise.
As useful and insightful as predictive metrics are, they can be complex to develop and execute. Organizations must have personnel with technical understanding to deploy models, and business understanding to extract value from models. Like every other business solution, you need to have the right people in the right seats with the right tools to create positive outcomes.
What are the risks when deploying KPIs?
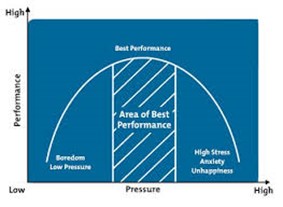
The Inverted U Theory, also known as the Yerkes-Dodson Law, can teach a lesson in the importance of choosing the right quantity of KPIs to deploy. The Inverted U Theory illustrates the relationship between pressure and performance and explains how to find the optimal level of positive pressure at which people perform their best. Too much or too little pressure can decrease performance. Replace “pressure” with “quantity of KPIs” and you will find the same effects on performance. As mentioned earlier, between five and seven KPIs is ideal for any individual display. Too few and you are not maximizing your resource’s bandwidth. Too many and you are likely introducing too much noise and not are aligned to your key objectives.1
Just as easily as KPIs can develop best practices and improve processes, they can promote bad behavior like tunnel vision and cross-functional friction. When one is focused on a certain aspect or activity, it opens the door to deviation from the main objective. For example, we can get good at tracking our throughput and efficiency, but what if we are missing the fact that the overall order book is dropping? This kind of thinking leads to blindness of external factors affecting the business and hampers efficient problem solving. Only considering internal factors as the cause of variance wastes valuable time and resources. If your personnel have tunnel vision, it means they are not using KPIs as a means to the answer but as the answer itself.
KPI metrics are helpful in guiding us towards the correct answer but are not the definitive solution. They are designed to create visibility and promote intelligent conversation. Being too caught up in the numbers results in the inability to take a step back and ensure that what you are doing is aligned with big-picture strategy.
How do I survive?
First, start with a solid foundation; KPIs are worthless if the organization fails to invest in process, people, and technology. Ensure processes support the key business activities that drive the right outcomes. Design the organizational structure to support those processes and hire and train people as needed. We often see training fall by the wayside, and this hurts the organization, especially as it scales. Ben Horowitz, in his book The Hard Thing About Hard Things, recommends managers – the people that develop the KPIs – train their personnel. Doing so tests knowledge and uncovers potential gaps in process. Then, it is important to invest in the right technology that extracts the data you need to develop determined KPIs.
Use the knowledge gained in this article to help you develop KPIs. Be deliberate about your objectives and embrace the iterative nature of the process by thinking through what you want to accomplish. If you cannot provide the “why” succinctly, as well as an example such that your personnel can have the “a-ha” moments required for learning, then you do not have a good understanding of what you are trying to do. Embracing the iterative nature of the KPI development process allows you to accept that it will not be perfect from day one and that you will need to stress test and periodically return to the drawing board.
With a solid foundation and KPIs in place you can hold personnel accountable. This includes everyone, from lower-level staff to the executive team. Be transparent about what metrics personnel are measured by and hold them to the metrics. This will require reports and visualizations for use by the management team.
If your organization needs to build a better foundation, become deliberate thinkers, improve accountability, or is ready to take the plunge into advanced analytics like machine learning, SLKone can help. Our collective experiences and partners have the skills and tools to maximize the value of KPIs in your organization.
1MindTools, The Inverted-U Theory
Download this Article as a PDF.